For publications & creators
Runway data, ready to publish
Measured colour data from every major fashion week, packaged for your story. Embed a live chart in an article, or download a graphic for Instagram Stories and Reels. Free for editorial use, with a credit.
- Free for editorial use
- Updates automatically
- No tracking
- 25,877
- runway looks measured
- 25
- fashion weeks
- 12
- cities
- 673
- shows
Season to date · January–October 2026
Three ways to use it
From newsroom to feed
Embed a live chart
Drop an interactive chart or table into an article, newsletter or live blog with one line of HTML. It stays current as new shows are measured, and resizes to fit your column.
For news sites, magazines, Substack and Ghost, live blogs
Build an embed →Post it on Instagram
Download a finished graphic sized for Stories, Reels and the feed, or a transparent sticker to lay over your own video while you talk through the trend.
For creators, stylists, commentators and brand social teams
Open the kit →Cite a figure
Quote a number in copy, a broadcast or a report. Every chart has a direct link to the exact view, so editors and readers can check the source.
For reporters, analysts, students and researchers
How to credit →Web embeds
Build an embed
- Choose a ready-made chart, or build your own
- Set the city, season, trend or theme
- Paste the code into your page
Works anywhere that accepts HTML: WordPress (Custom HTML block), Ghost and Substack (HTML embed), Webflow, Squarespace and most CMS templates. The optional script, added once per page, resizes every embed to fit its content.
Instagram kit
Graphics for Stories & Reels
Punchy, single-idea cards built for the phone screen: one number, one colour, one finding. Download them as Story and Reel frames, 4:5 feed posts, or transparent stickers to drop into your video while you add the commentary.
The season in colour. Runway colours measured look by look across the season. Data: Fashion Field Notes · fashionfieldnotes.com
Key content sits inside Instagram's safe zone, clear of the profile bar and reply field.
Animated Stories & Reels
Trends that play out on screen
Each one is a 9:16 video at 1080 × 1920, about ten seconds long, with the source and credit drawn in. Instagram takes the MP4 for Stories and Reels; the GIF is for everywhere else.
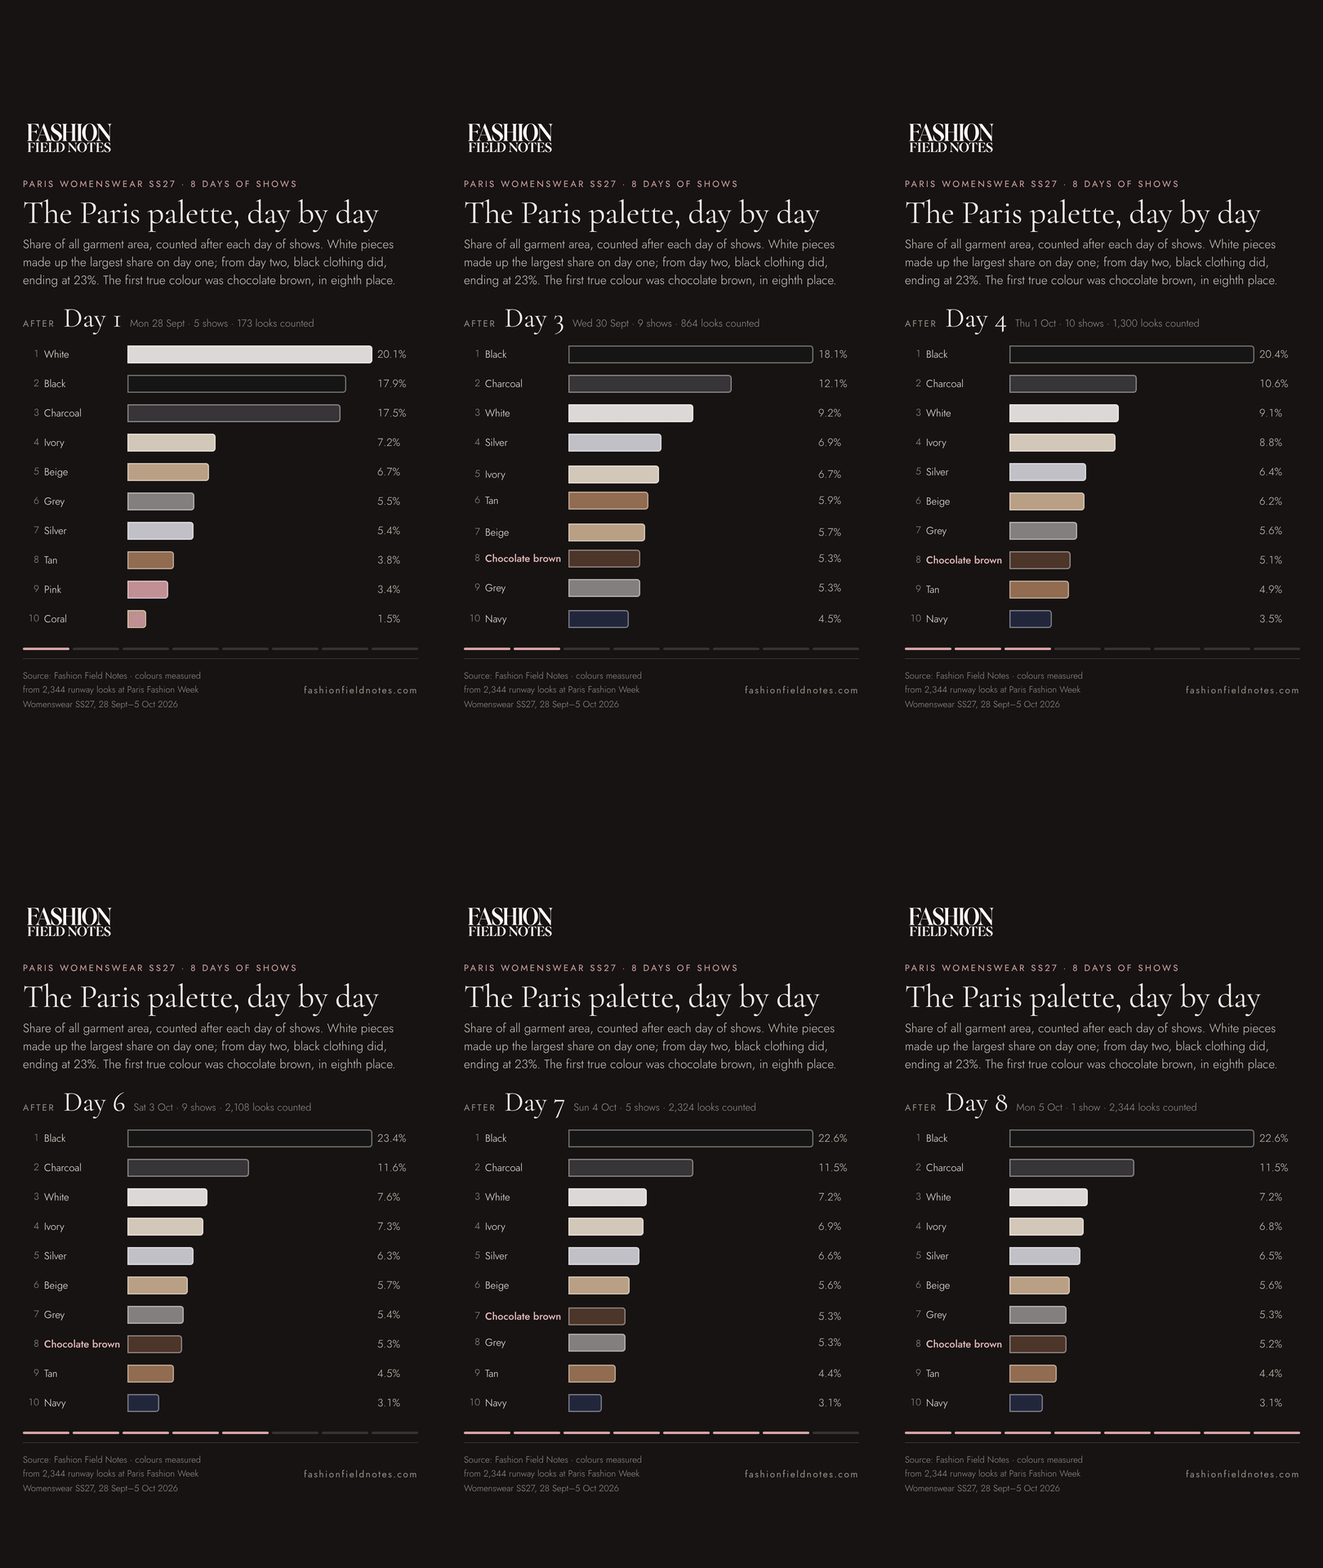
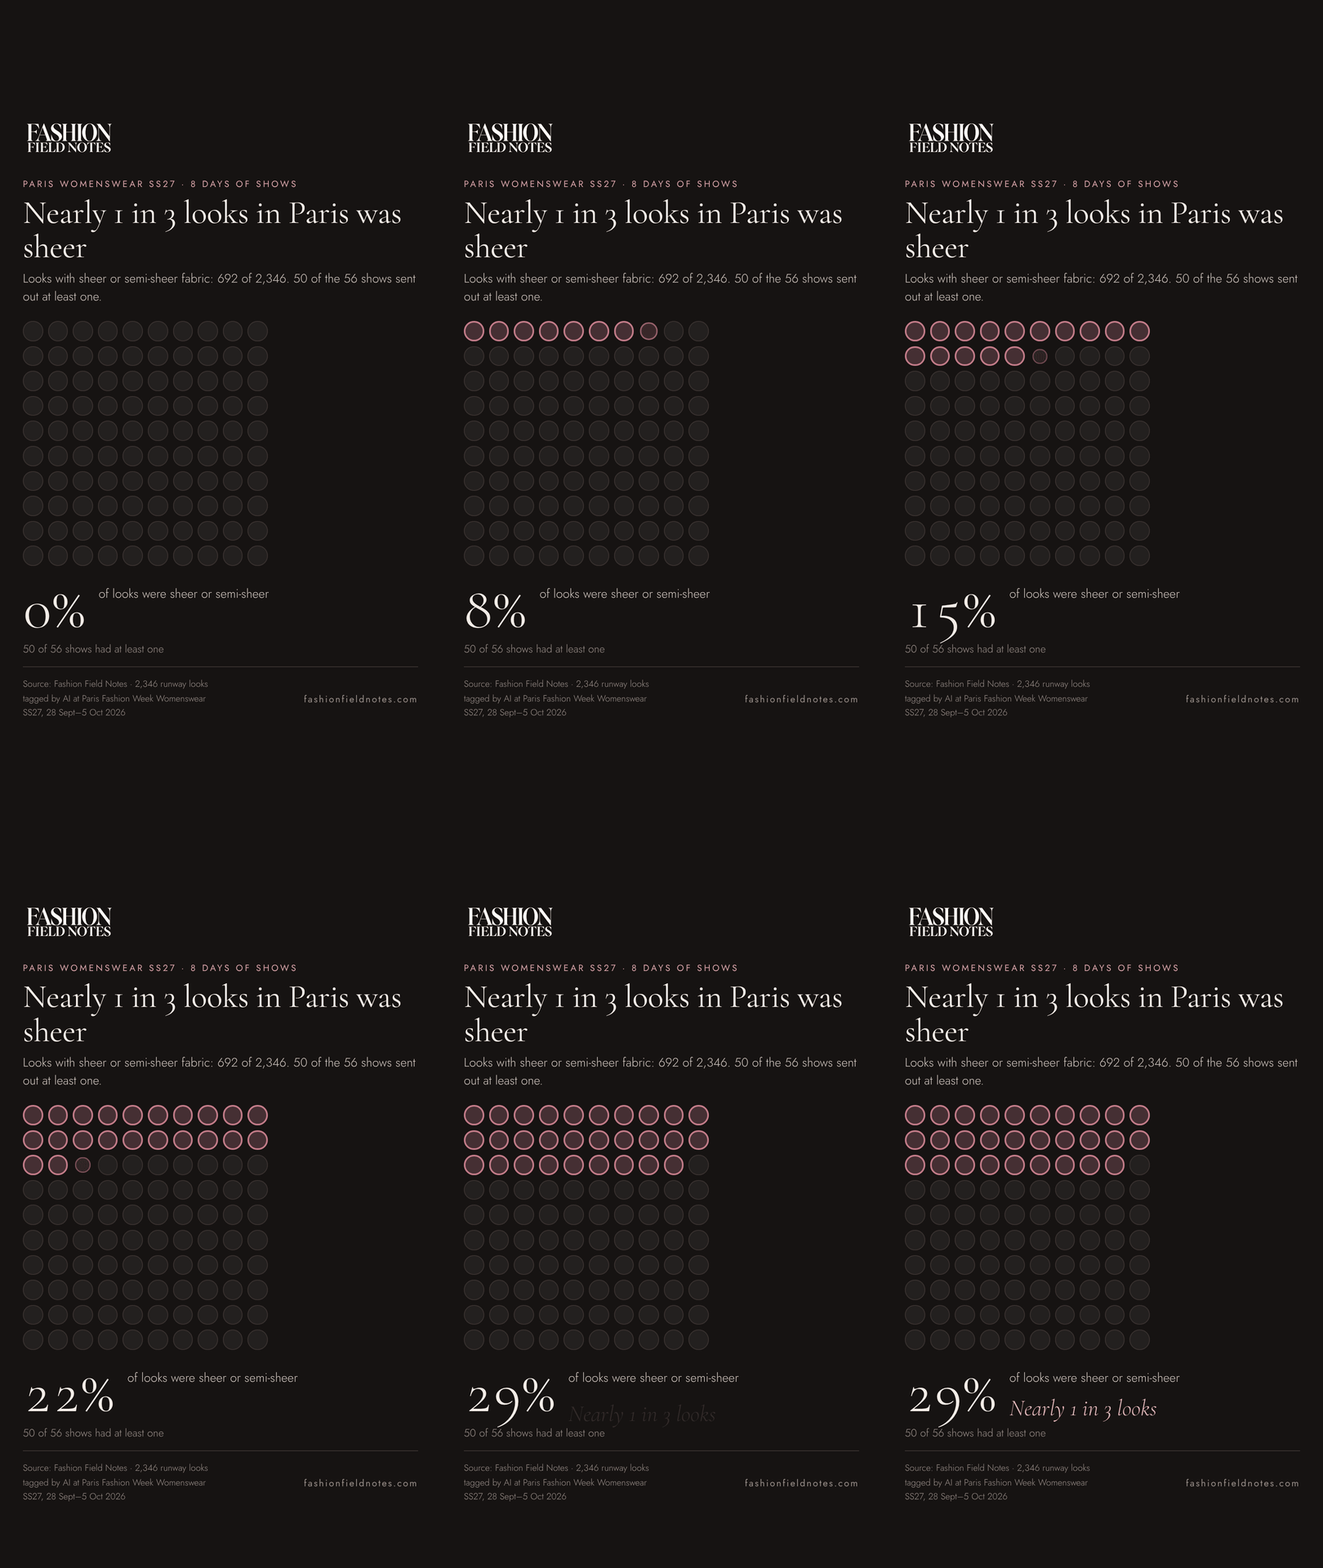
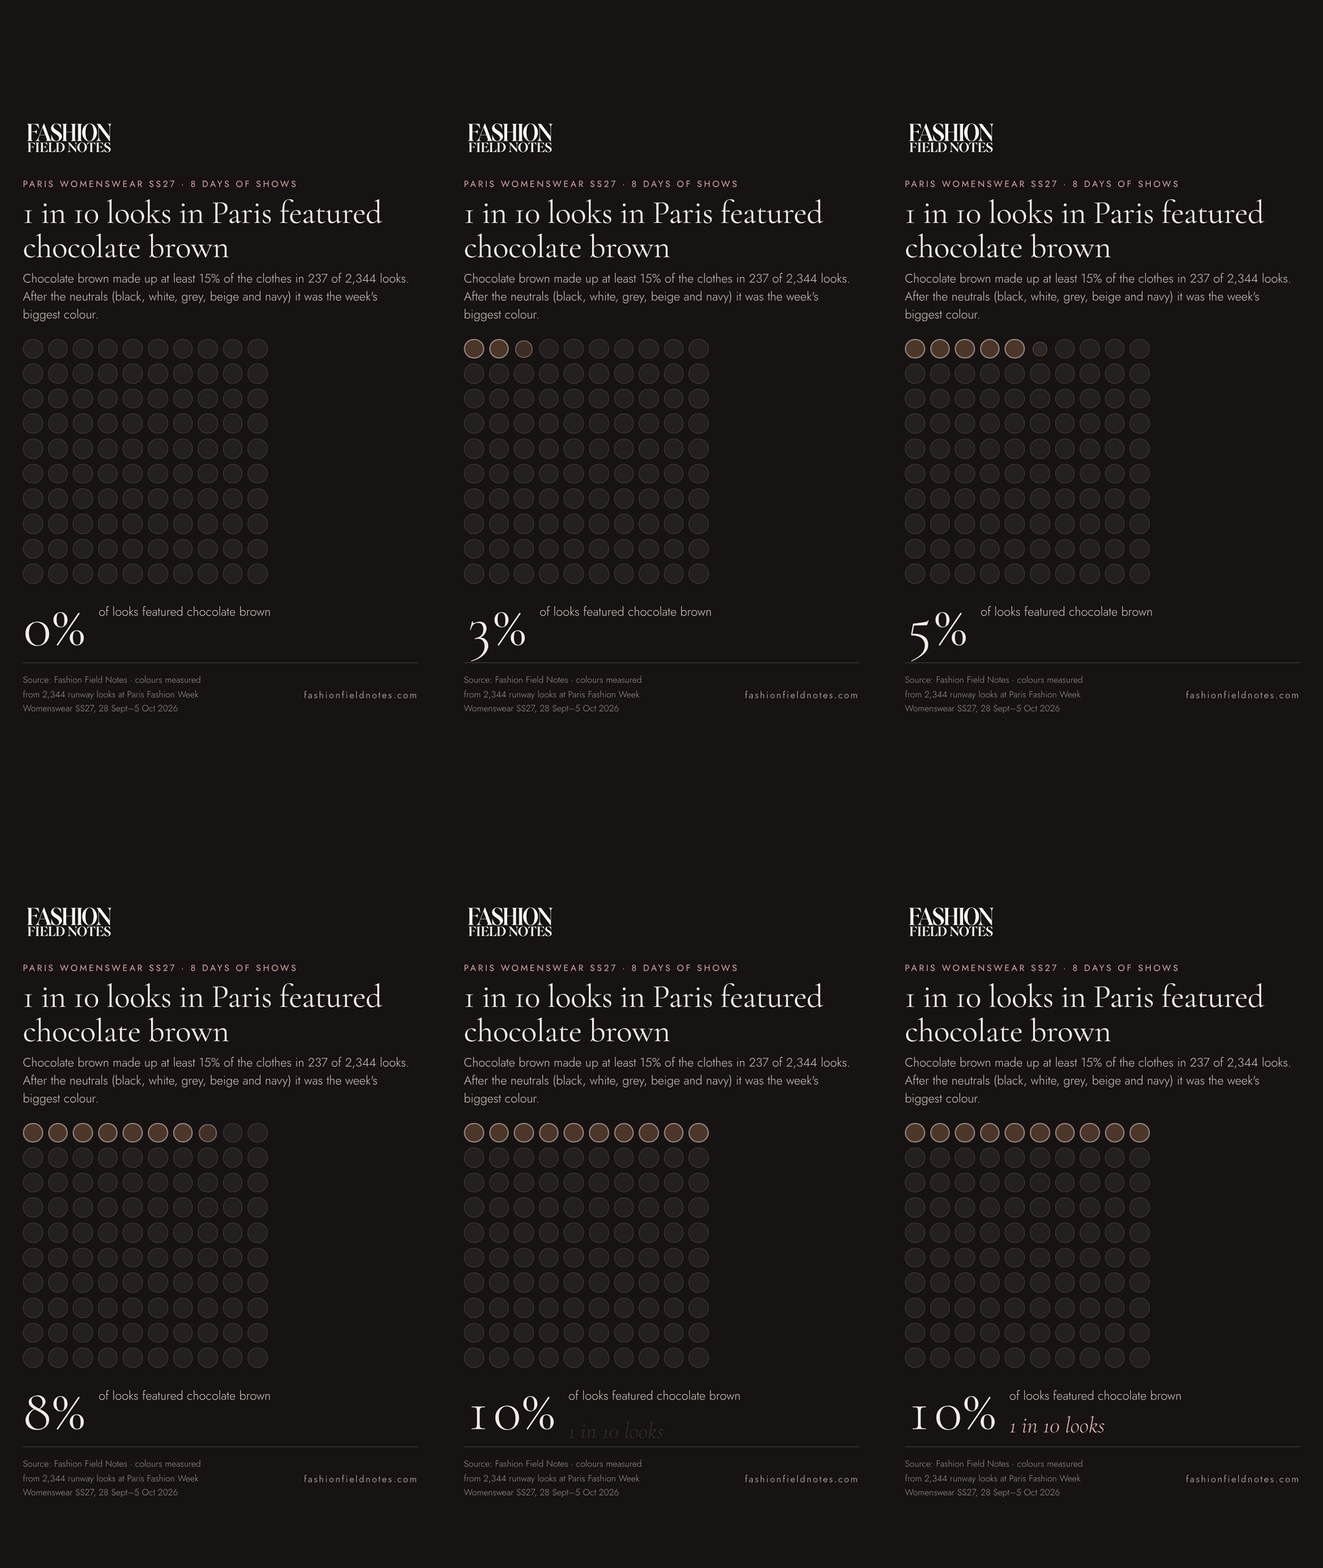
Use the 9:16 frame as a cut-in between talking shots, or the sticker as an overlay while you speak.
Post the frame as is, then add a link sticker to the matching page so followers can explore it.
Pair the 4:5 cards: the season, then a city, then its signature colour, makes a ready-made three-slide post.
The credit is built into every graphic. Please leave it visible, and tag or link Fashion Field Notes in the caption.
Licence & credit
Using our data
You're welcome to
- Embed charts and tables in editorial work, free of charge
- Post the graphics on Instagram, TikTok and other social platforms
- Quote figures in articles, broadcasts, newsletters and research
- Use the light or dark theme to match your page
- Post the animated charts as GIFs on social and in newsletters
We ask that you
- Keep the Fashion Field Notes credit and link in place
- Don't crop, recolour or alter the figures in a graphic
- Don't reuse runway photographs; they are not ours to license
- Ask first before using the data in advertising or a paid product
Credit line
Use this wherever the data appears, in print, on air or in a caption.
Data: Fashion Field Notes (fashionfieldnotes.com)Figures can change as more looks are measured. When citing a number, note the date you accessed it.
Methodology
How the numbers are made
Collected
Every look from each show is collected from official fashion week and brand sources, then matched to its house and event.
Measured
The garments in each photograph are separated from skin and background, and their pixels are sorted into a fixed list of named colours.
Compared
Shares are worked out per fashion week and per city, and a finding only counts when it holds across many looks and several houses.
Refreshed
New fashion weeks are added every two weeks; embeds and graphics re-render from the latest data every ten minutes.
Questions
Frequently asked
Is it free?
Yes. Embeds and social graphics are free for editorial and non-commercial use, with the credit left in place. For advertising, paid campaigns or product use, get in touch first.
How current are the numbers?
Every embed and graphic is rendered from the latest measured data and refreshed every ten minutes. New fashion weeks are collected every two weeks, so figures can move as more looks are measured.
How do I cite a specific number?
Use the direct link under each embed: it opens the same view on our site. In print, cite the figure with the credit line and the date you accessed it.
What exactly is measured?
Colours are measured from the pixels of the garments in each runway photograph, not from show notes or reviews. Each look is split into its colours, so a share is the share of clothing area, not of looks, unless we say otherwise.
Can I use the runway photographs?
No. Embeds and graphics show charts and figures only; the photographs belong to the houses and photographers and are not licensed for reuse.
Will the embed slow my page down?
No. Each embed is a lightweight, server-rendered page with no tracking and no third-party scripts, and it loads lazily as the reader scrolls to it.
Need something custom?
A cut for a specific city or house, a chart in your brand colours, or the underlying figures for a feature.
Get the fortnightly digest